A picture is worth a thousand words.
Visual analytics can be a powerful tool for sharing research outcomes with diverse publics, one of the main objectives of the Canada Research Chair (CRC) program in Sustainable Community Development. They illustrate qualitative and quantitative information in graphics and figures that communicate complex patterns, relationships, and contexts between scientific concepts and theoretical frameworks. Adding a spatial dimension to the presentation of data enables a richer understanding of concepts, ideas and theories by engaging our visual pattern recognition and spatial reasoning abilities (Risch, Kao, Poteet & Wu 2008). In addition, visuals reduce the complex cognitive requirements for processing information and enhance our ability for synthesizing data and gaining insights on its meaning and / or implications (Keim, Mansmann, Schneidewind, Thomas, & Ziegler, 2008).
As we near the SSHRC funded completion of the CRC program, we are hoping that we have helped to bring greater meaning to sustainable community development, illuminating the complexities of relationships between individuals, community and sustainability, and the challenges in terms of determining exactly what contributes to changing current unsustainable development pathways.
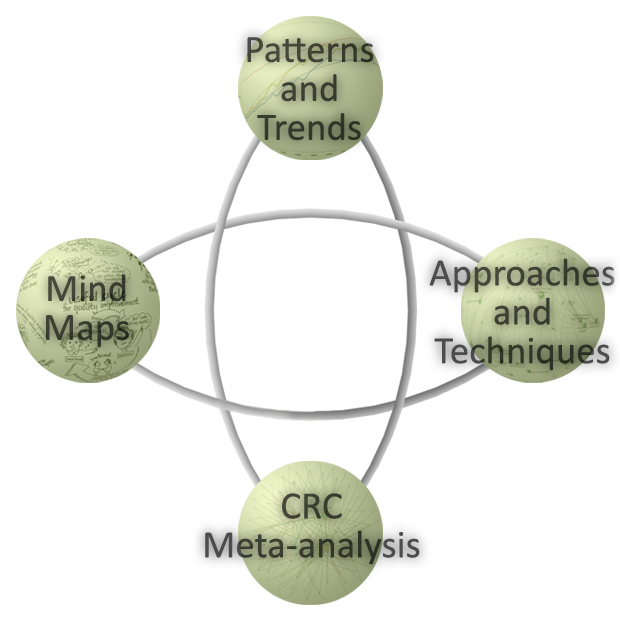
Our visual analysis includes trend analysis, mind mapping, meta-analysis of our on-line case studies and e-Dialogues, as well as new methods for creating visuals from data. Click on the spheres below to explore our visual research outcomes from our ten-year research program.
Keim, D. A., Mansmann, F., Schneidewind, J., Thomas, J., & Ziegler, H. (2008). Visual analytics: Scope and challenges (pp. 76-90). Springer Berlin Heidelberg.
Risch, J., Kao, A., Poteet, S. R., & Wu, Y. J. J. (2008). Text visualization for visual text analytics. In Visual Data Mining (pp. 154-171). Springer Berlin Heidelberg.