February 28th, 2013
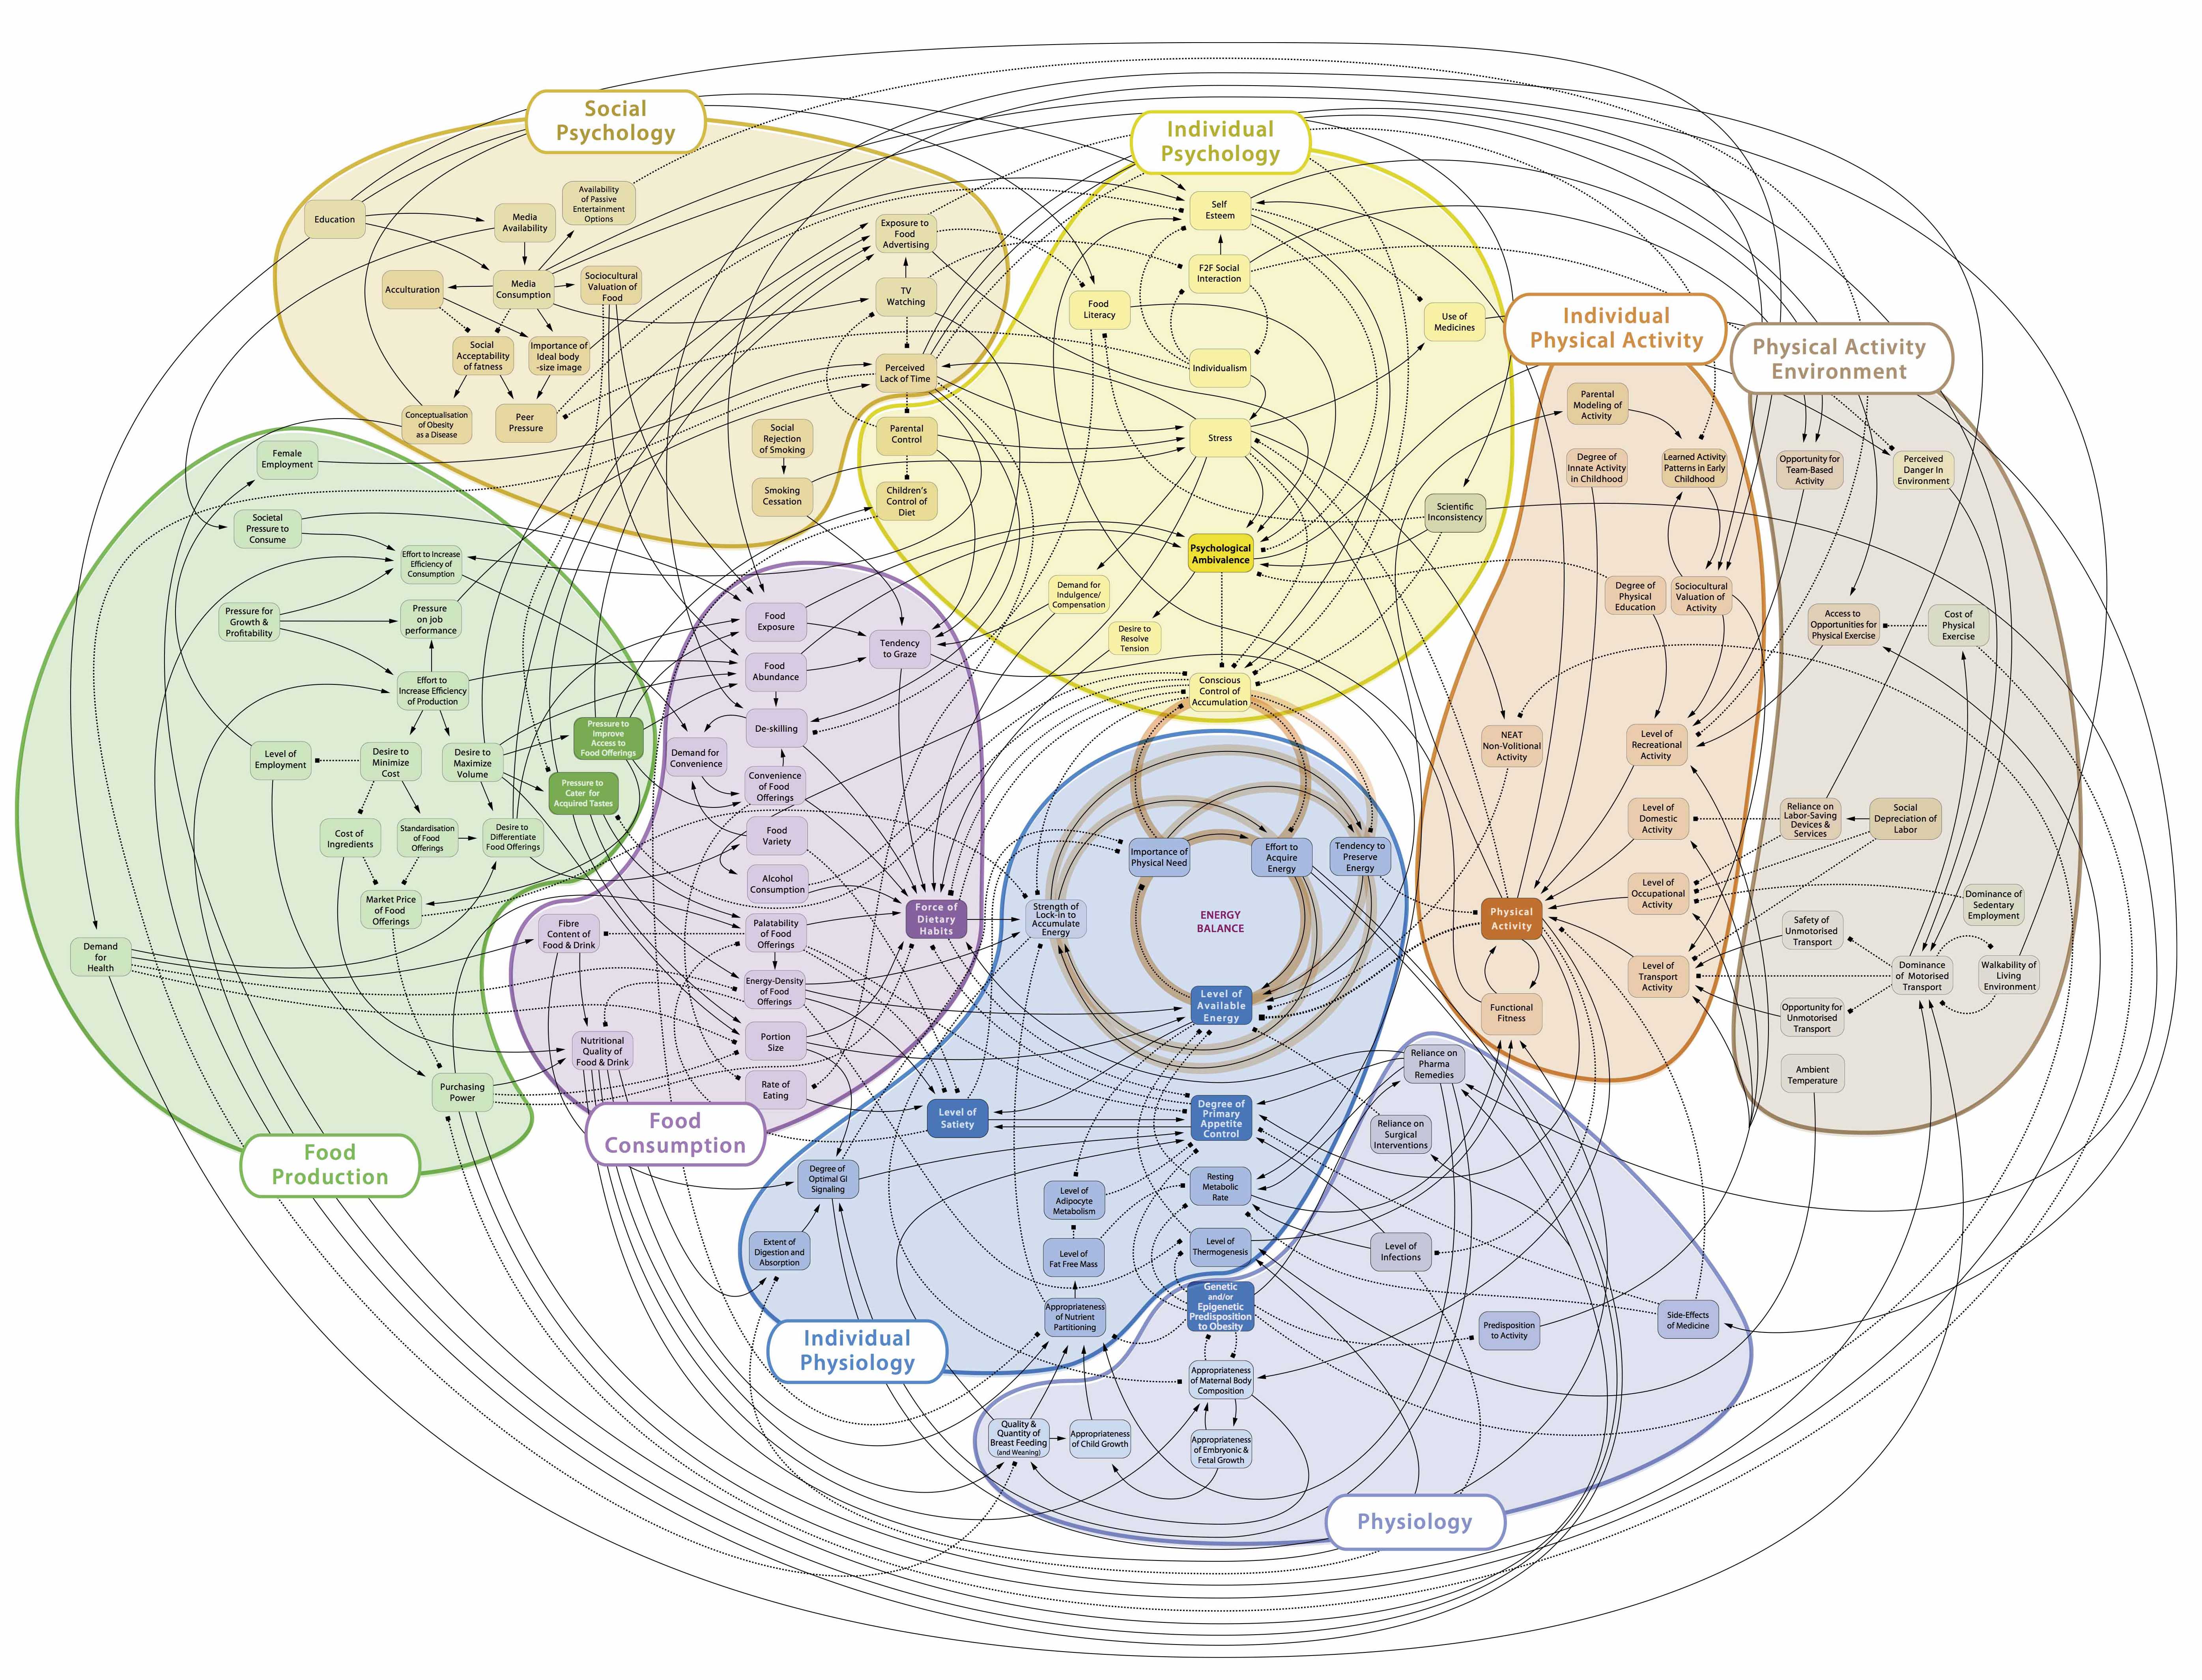
Last week, we released the Solutions Agenda dialogue on sustainable food systems. We discussed the complexities surrounding sustainable food systems and how these systems are also linked to social factors such as access to housing, culture, and employment. This interactive animation, developed from a systems map created by ShiftN, displays the interrelated factors that influence nutrition and physical health, with a particular focus on causes of obesity.
ShiftN created the map with the intention of identifying the systemic reasons behind obesity. Of the nine categories influencing obesity, only two categories directly relate to food (i.e., food production and food consumption), which shows that obesity has a far wider variety of influences than simply over-consumption. For example, the map shows how increasing sedentary lifestyles and reliance on motorized vehicle transport influence obesity. What we ‘see’ from this system map is that nutrition and physical health go beyond personal diet and food choices; they are shaped by the way we design our communities and structure our societies, our hard and soft infrastructure choices.
Click on the image below to access the interactive version. Factors can be seen by scrolling over their respective labels. Scroll over various areas of the map to identify clusters of the factors, and click on a cluster to zoom in on the area. Scroll over the centre (“Energy Balance”) to see all clusters.
We built on ShiftN’s map to highlight the systems complexities of nutrition and physical health.
- Log in to post comments


CRC Comments
CRC Comments
Of the nine groups impacting
Of the nine groups impacting being overweight, only two groups directly correspond with meals (i.e., meals production and meals consumption), which reveals that being overweight has a far broader variety of impacts than simply over-consumption. For example, the map reveals how increasing inactive way of life and dependency on electric vehicle transportation impact being overweight.
Pagination