Our research project, MC3: Meeting the Climate Change Challenge has two phases. The first phase, 2012—2014, interviewed 11 local government climate innovators. The second phase of the research, as one of its deliverables, re-interviewed a sub sample of the original interviewees in order to track if any changes had occurred in their development paths. Included in this sub sample were interviewees with the elected officials from the virtual conversations led in the first phase.
Prior to analyzing the second interview data, we revised the coding framework used in the first phase and ensured consistency with the three theoretical lenses we were using for the second phase of the research—socio-ecological systems, multi-level governance and social practice. With over one hundred interviews across eleven local governments, we then analyzed all of the interview transcripts around 80 refined codes (referred to as topics).
Next comes the fun part: asking questions of the data. What is the number one topic across all the local governments? Which local governments are most closely linked in their vocabulary? What are the topics hardly anyone is talking about? How do the topics change from year to year? Our new visualizations apply these questions to the interview data and reframe them in an engaging, visual way. Check out our interactive visualization on Changing the Conversation.
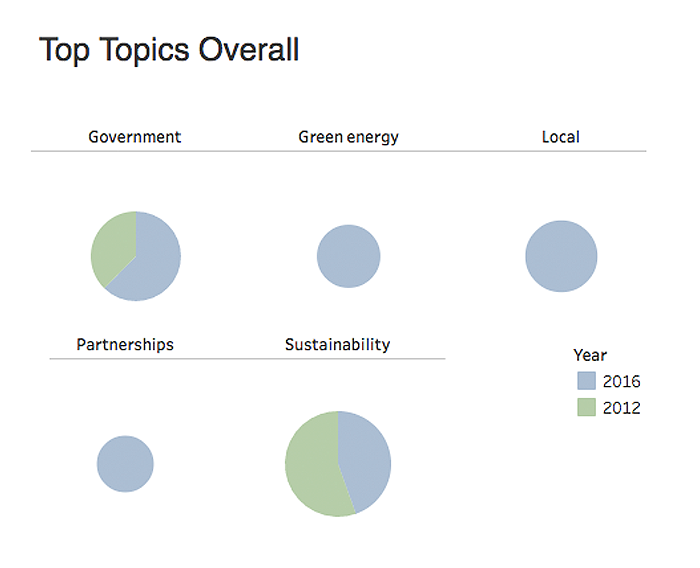 Click on the image above to view the interactive version of this visualization