Why are some communities resilient, adaptive and innovative in the face of change,
and others are not?
What is the relationship, if any, between resilience, innovation, anticipatory governance, sense of place
and sustainable development?
We explored these questions through an in-depth analysis of the concepts and ideas emerging from the CRC case studies and e-Dialogues. The relationships between the concepts and ideas are complicated and dynamic, thus we explore them through interactive visualizations that allow the user to control, manipulate and isolate variables from the data to tease out insights and meanings of the greatest interest.
We will begin releasing visuals every two months that explore the dynamic relationship between place, anticipatory governance, resilience and innovation over the next few months. We will then prepare publications summarizing research outcomes and connections of the CRC theoretical framework.
Click here to see details on our data methodology.
This webpage is currently under development, and active links and resources will be added as the page develops.
Place, Innovation, Resilience and Anticipatory Governance
Click on the images below to visually explore the results of the work completed over the 10-year funded research program. Data used for the figures were derived the case studies and e-Dialogues conducted over this 10 year period.
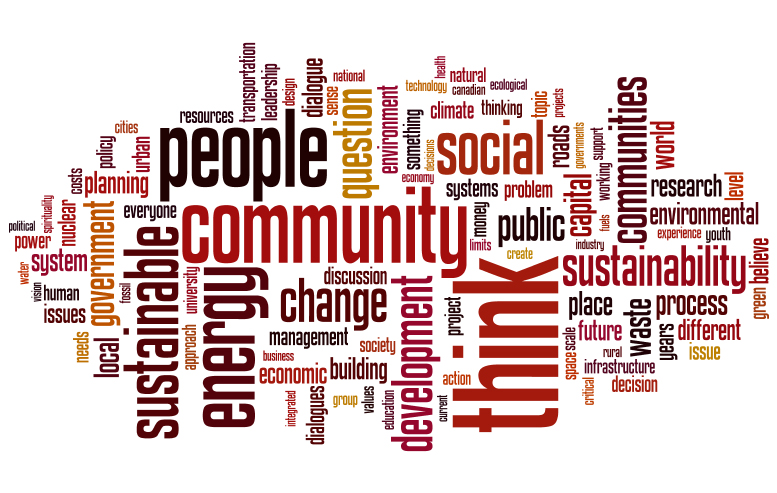 |
Word clouds are visual tools for illuminating the prevalence and relationships between certain terms, concepts, or ideas in a body of text or literature. These word clouds reveal the prevalence of concepts within the CRC case studies and e-Dialogues developed over the funded 10-year Canada Research Chair in Sustainable Community Development research program. |
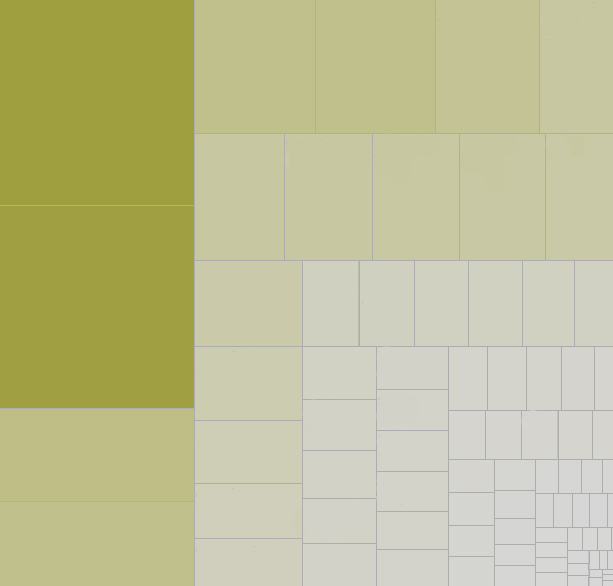 |
Area based visualizations are tools for organizing hierarchical data in a meaningful way that allows for patterns to be easily observed. These Concept Area Maps examine the themes of Place, Innovation, Resilience and Anticipatory Governance and reveal the importance of key concepts extracted from the CRC case studies and e-Dialogues developed over the funded 10-year Canada Research Chair in Sustainable Community Development research program. |
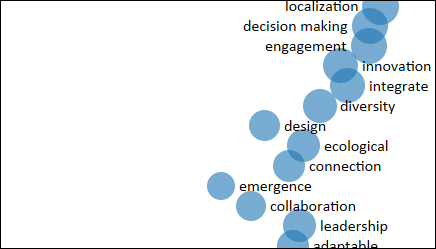 |
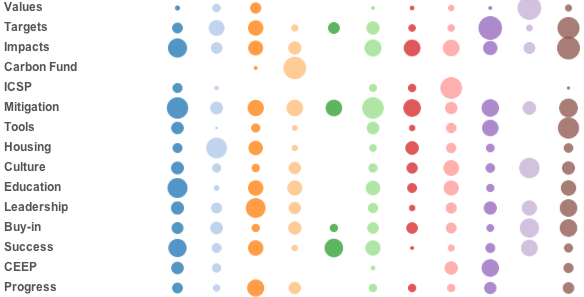
This meta-data conceptual relationship visualization explores relationships between concepts that have emerged through the last 10 years of the Canada Research Chair in Sustainable Community Development program. Using the results of a meta-analysis of 53 CRC case studies and 55 e-Dialogues, this visualization illuminates connections between ideas, allowing for exploration of possible co-benefits of acting in one area with another and potential complementary actions. |
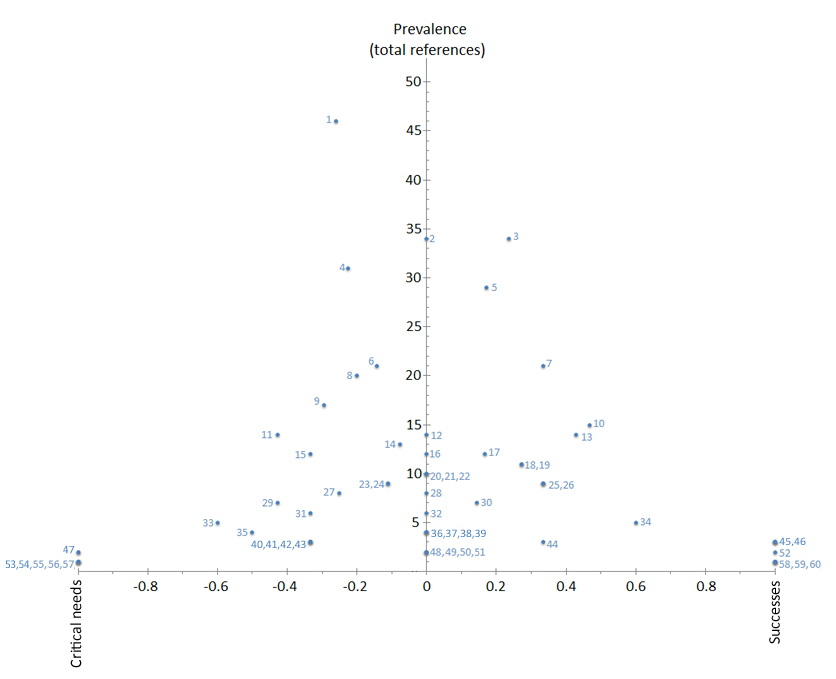 |
The community successes and critical needs visualization explores the successful aspects of a community innovation, plan or initiative and also the challenges, barriers or issues communities face in attempting to implement plans or execute projects. These lessons are captured through a meta-analysis of the ‘What Worked’ and ‘What Didn’t Work’ sections of 53 online CRC case studies. The visualization arranges conceptual information derived through this meta-analysis on a graph according to its prevalence in and relationship to (in terms of community needs and successes) the case studies. |
In addition to the CRC meta-analysis, we have also conducted a meta-analysis on the Meeting the Climate Change Challenge (MC3) case study data to elucidate common drivers and barriers to community climate action.
 |
These Word Clouds were derived from interview data used to develop the MC3 case studies. Each word cloud shows the key concepts that emerged through the data for a respective community and displays these concepts by their relative strength. |
|
|
These raindrop plots provide a deeper exploration of the research outcomes from our climate adaptation and mitigation research, MC3 case study data. The visualization explores patterns, similarities and differences among BC study communities, to understand the challenges and leading innovations of climate action in each of the communities. |
|
|
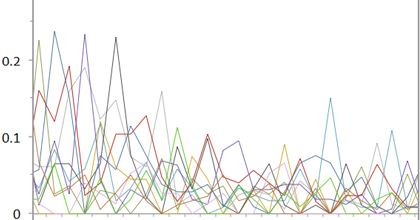
This conceptual frequency curve provides visual representations of the strength of particular concepts within the MC3case study data. This visualization can be used to identify common concepts and ideas in each of the community case studies (and the research as a whole), allowing for exploration of over-arching themes and comparisons between the case studies. |
Click here to return to main visualizations page.
Angus, D., Rintel, S., & Wiles, J. (2013). Making sense of big text: a visual-first approach for analysing text data using Leximancer and Discursis. International Journal of Social Research Methodology, 16(3).